Welcome to CoCoBLAST!
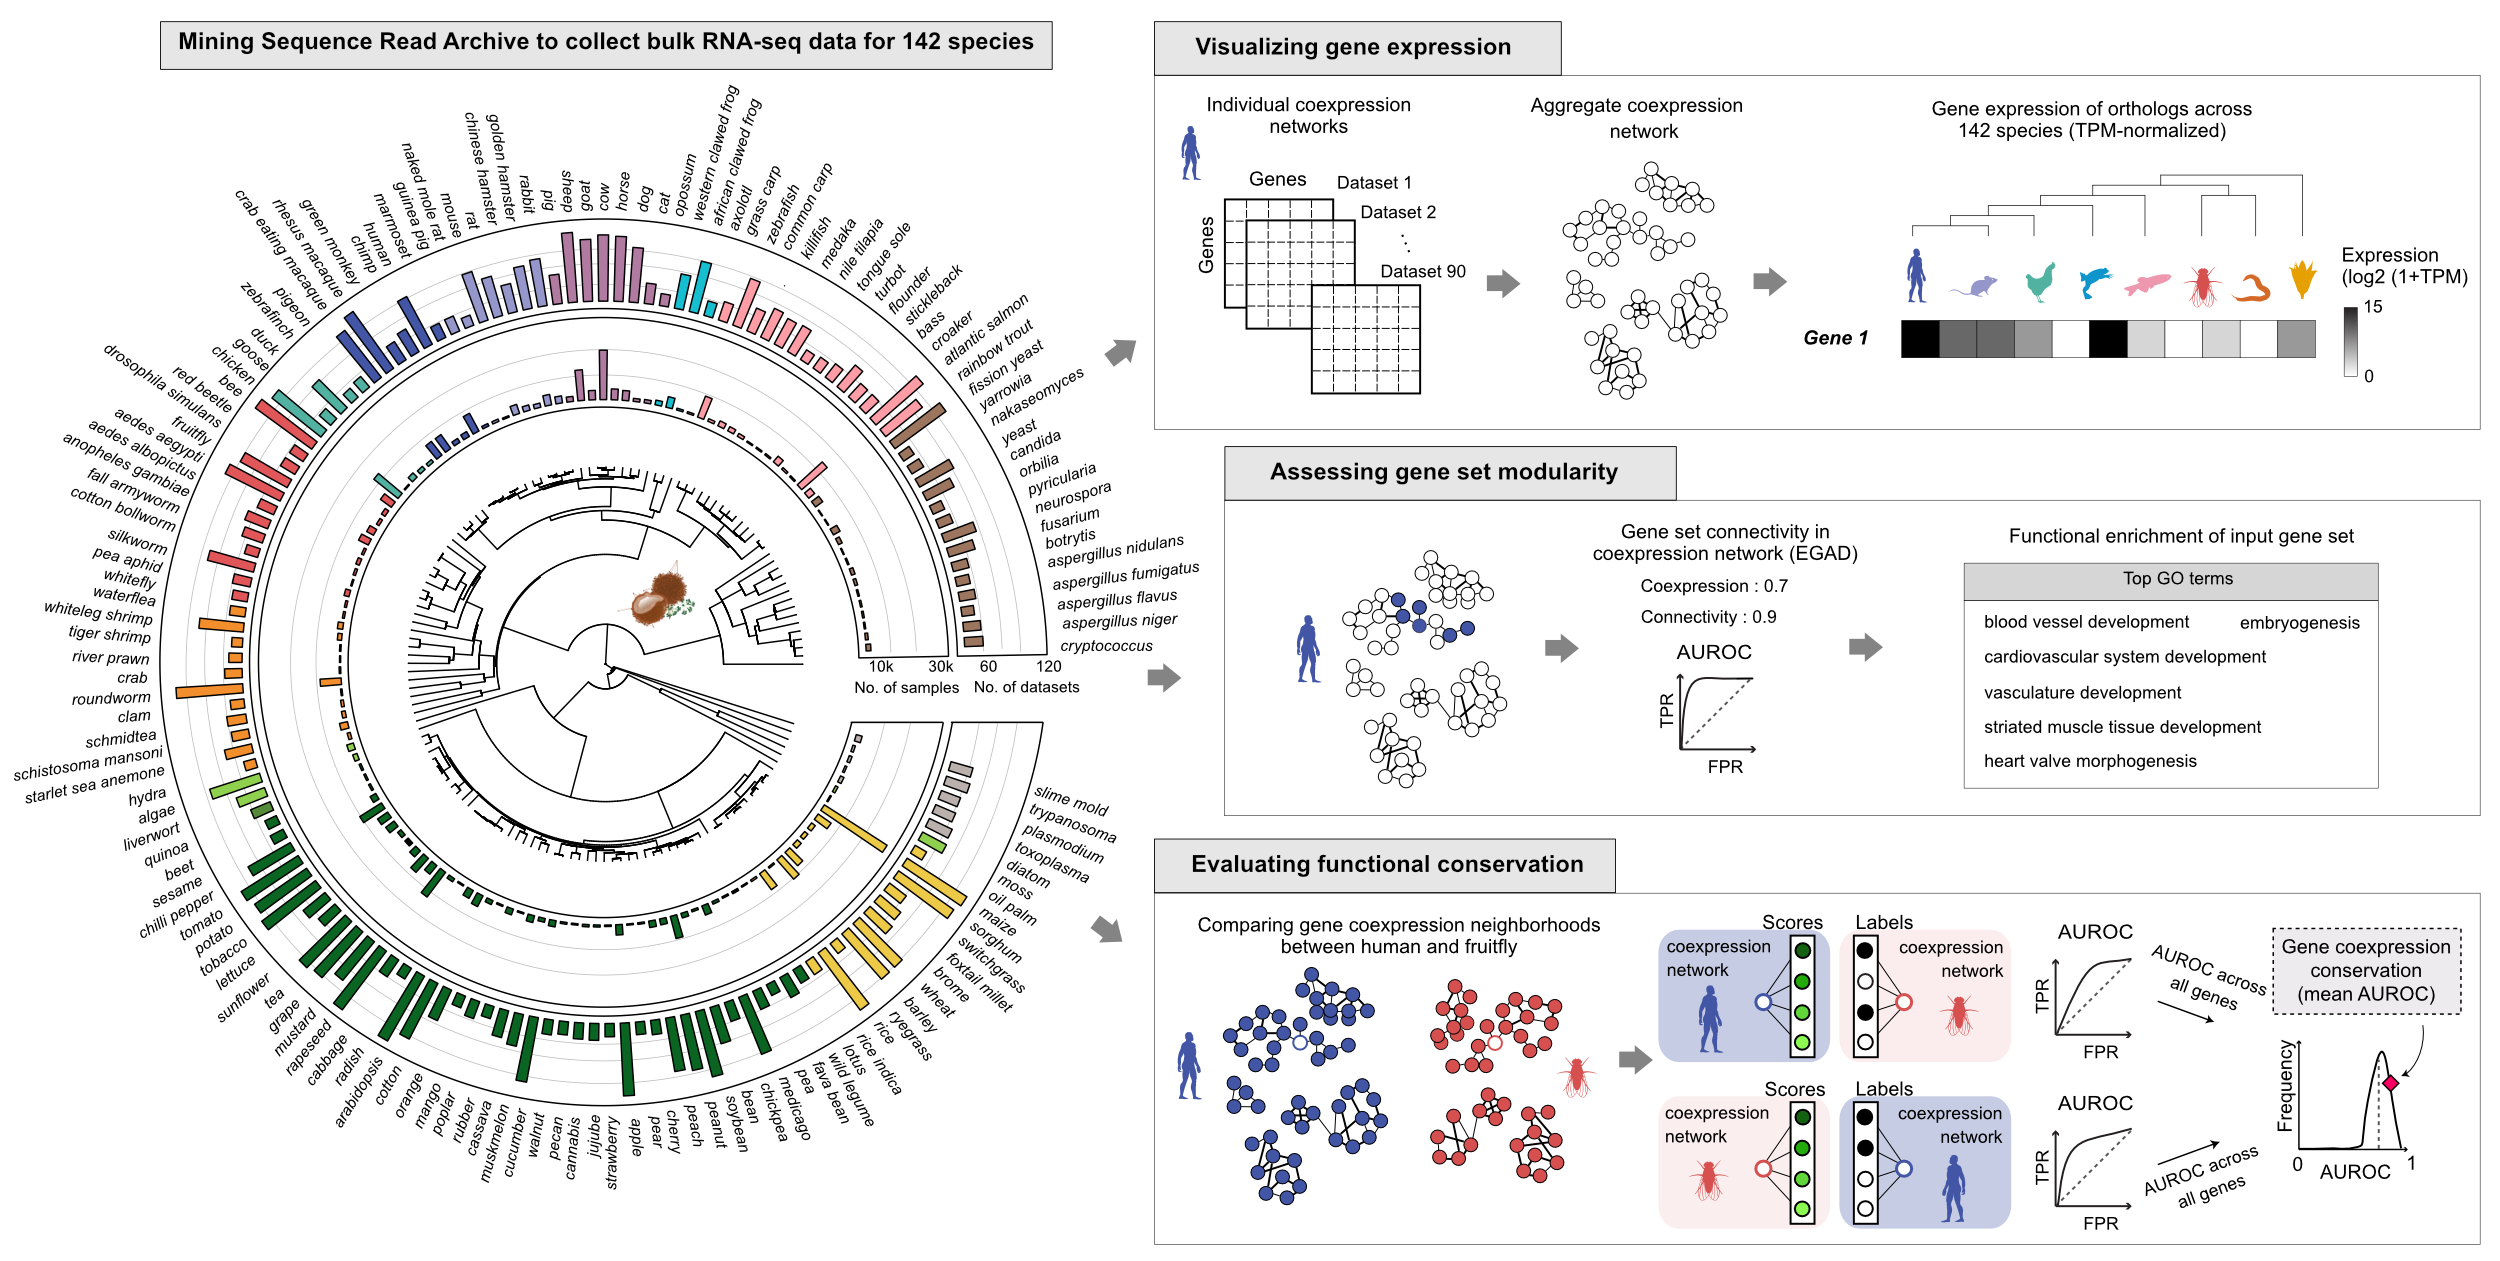
How can we study gene function across phylogenetically diverse species? One way is to compare gene coexpression signatures across species because genes that share a function are expressed in similar contexts. We collected 362,772 samples from 7,767 datasets, and built high-quality, meta-analytic gene coexpression networks for 142 species. (details on coexpression network construction available at CoCoCoNet 1). We obtained orthology predictions for 142 species from eggNOG DB 2 . This large collection of data permits the evaluation of coexpression relationships across the tree of life: from fungi to animals to plants.Our coexpression connectivity and conservation metrics
We use EGAD 3 to check if the genes of interest form a cohesive module in a coexpression network. The neighbor voting method predicts whether a gene belongs to a set by counting how many of its network neighbors already belong, then ranks genes by this count to measure predictive performance. A high AUROC indicates that genes with a similar connectivity also share a known annotation (i.e., belonging to the same gene set, or functional category).The coexpression conservation score 4 measures how well a gene’s coexpression partners in one species are preserved in another, calculated as the average AUROC of neighbor rankings in both directions.
With CoCoBLAST, you can input a gene (or a set of genes) of interest within a reference species and perform the following analysis:
- explore the expression of orthologs across 142 species,
- evaluate the connectivity of genes in the reference coexpression network, and
- search for genes with conserved coexpression partners in a target species
Feel free to contact Hamsini Suresh at hamsinisuresh6@gmail.com (or) Leon French at leon.french@utoronto.ca to report an issue, suggest an update, or ask for help.
Gene Expression
To query the expression of a gene in multiple species, input a gene from a reference species, then hit “Submit”. CoCoBLAST will output the TPM-normalized expression of the gene (and its orthologs in other species), and visualize the log2-scaled expression values across the species phylogeny using a circular heatmap.Enter gene
Gene expression
Explore the expression of gene (or homologs) across species (TPM-normalized)
Plot heatmap of expression across species (log2(TPM + 1))
Coexpression conservation
To query coexpression conservation scores, input a gene from a reference species, select a target species, then hit “Submit”. CoCoBLAST will then do several tasks:- It will find the 50 top coexpressed genes in the target species, showing each gene pair’s rank, as well as the reciprocal rank.
- Next, it looks for paralogs for each input gene in the reference species, maps these via orthology to the target species, and plots a heatmap and network of coexpression conservation scores.
Coexpression Conservation
Tables
Figures
Gene set connectivity
To query the modularity of a set of genes, enter a comma-separated list of gene names or IDs from one of the 142 species, and hit “Submit”. CoCoBLAST will then summarize the following:- Coexpression of genes within the species-specific coexpression network.
- Connectivity of genes within the network. Since genes with shared functions are preferentially connected, CoCoBLAST uses the EGAD R package to assess the strength of coexpression of input genes relative to random gene sets of equal length.
Enter list of genes
Gene set modularity
Gene set coexpression:
Gene set modularity (strength of coexpression relative to random gene sets of equal length):
Functional enrichment of gene set
List of GO terms associated with input gene set
Downloading CoCoBLAST raw data
We have mined NCBI's Sequence Read Archive to collect bulk transcriptomic data from over 7,000 studies and 360,000 samples spanning 142 species across the tree of life. This large-scale resource provides multiple file types for download, such as gene expression, coexpression and conservation matrices, all organized for easy access and analysis.Browse files by category
Gene expression matrices (with CPM, TPM and RPKM-normalized values): hereGene coexpression matrices (one per species): here
Gene coexpression conservation scores (for pairs of species): here
Homologous gene sets (derived using eggNOG-mapper v2.1.12): orthologs, paralogs